
How to Diagnose a Sudden Ecommerce Conversion Rate Drop
A sudden conversion-rate drop is an incident label, not a root-cause verdict. Freeze the metric, localize the break, and assign one owner to one bounded validation.
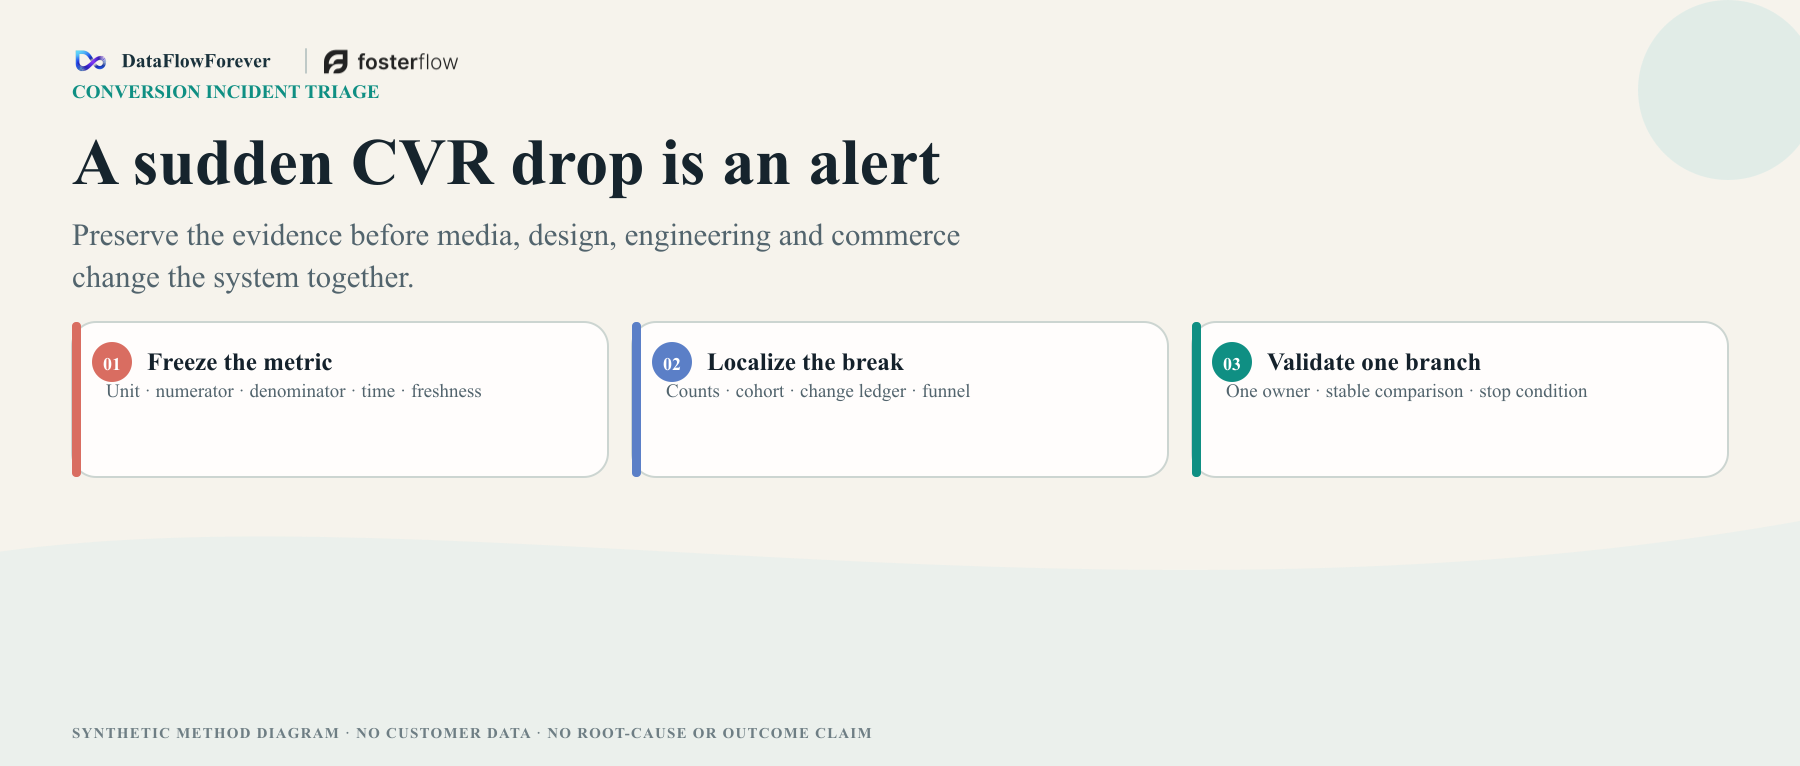
A sudden conversion-rate drop can turn a routine operating review into four investigations that interfere with one another.
Paid media blames traffic quality and tightens targeting. Engineering checks the weekend release and starts reverting code. Design prepares a new mobile hero. Ecommerce adds a discount to recover volume. If all four changes go live, the next result will be harder to explain, whether conversion recovers or declines again.
The better starting point is simple: a sudden conversion-rate drop is an incident label, not a diagnosis. Freeze the definition of the metric. Confirm the change with absolute counts and mature data. Find the smallest reproducibly affected cohort. Align the change point with a cross-system change ledger. Trace the journey to the earliest observable break. Then assign one primary owner to one bounded validation with a counter-signal and a stop condition.
This is an incident-localization method. It is not a generic traffic-to-sales audit, a product-page redesign checklist, or an implementation guide for repairing every event. Its purpose is to preserve the team's ability to learn from the next action.
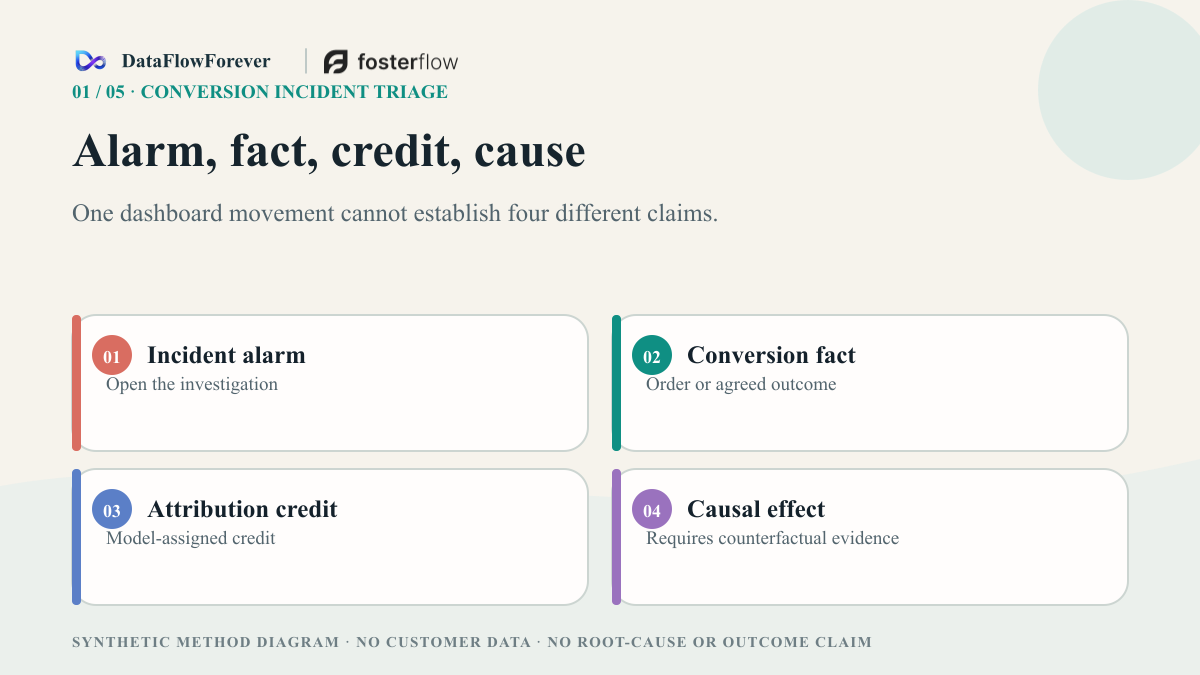
1. Give the metric a passport before interpreting it
“Purchase conversion rate” can describe several different ratios. An ad platform may divide attributed purchases by ad clicks. An analytics product may divide purchase events by sessions. A checkout report may divide completed checkouts by checkout starts. The commerce backend may divide confirmed, deduplicated orders by visits that were actually eligible to purchase.
Those views can all be useful, but they do not answer the same question. Before triage, record a metric passport and keep it fixed:
- Decision: What decision is this metric allowed to support?
- Conversion unit: Is the numerator an event, person, session, cart, checkout, order, or confirmed valid order?
- Numerator: Which state counts as success, and how are duplicates, tests, cancellations, refunds, and late confirmations handled?
- Denominator: Is the eligible population all visits, consented visits, qualified visits, ad clicks, real page arrivals, or entrants to a particular funnel stage?
- Scope: Which site, market, language, device, channel, product, and customer state are included?
- Time: Which timezone, day boundary, observation window, comparison window, and weekday pattern apply?
- Data state: What are the freshness expectation, identity and deduplication rules, consent boundary, late-event policy, and expected backfill time?
- Fact source: What can the ad platform, analytics tool, order system, and payment system each establish?
Google Analytics documents that data availability varies by processing and reporting context in its data freshness guidance. Its explanation of differences between reports and explorations also describes how supported fields, user identity, modeling, and processing choices can affect output. These documents do not prove that a particular store's decline is reporting delay. They support a narrower rule: do not promote an immature number to a business fact before its agreed availability window.
Shopify's guidance on analytics discrepancies similarly describes why tools can differ because of cookies, timezones, traffic filtering, and attribution rules. The safe conclusion is not that every system is unreliable. It is that each number needs a named purpose, source, unit, and maturity state.
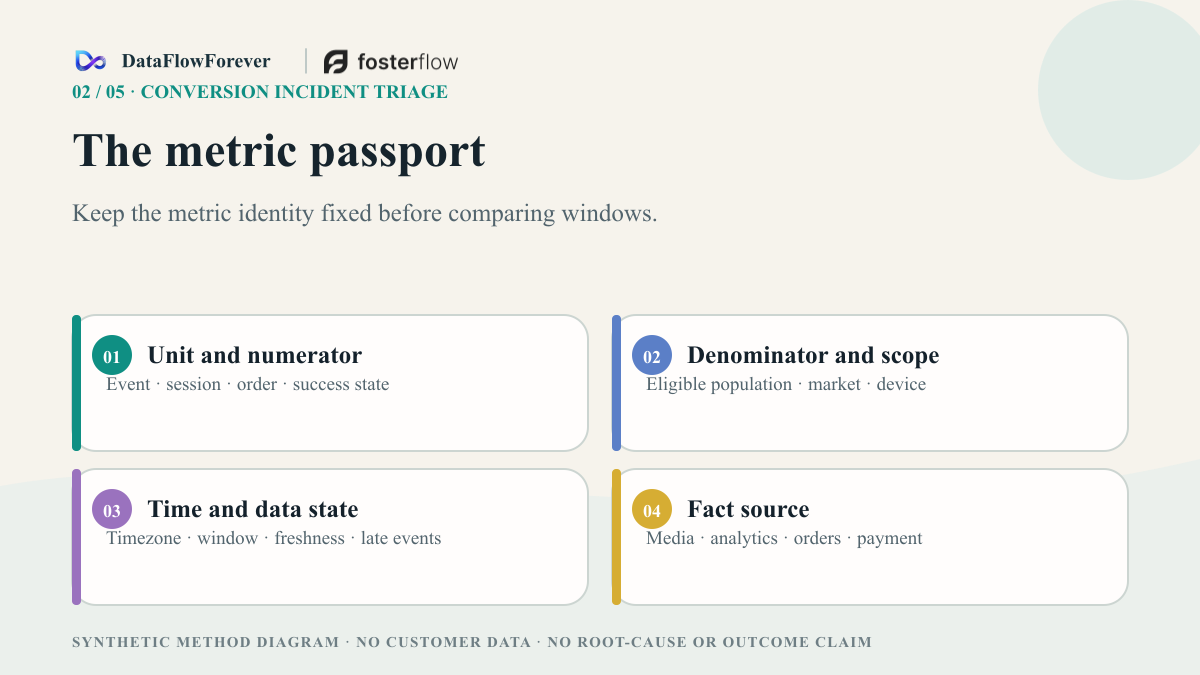
Keep three layers separate as well. A completed order is a conversion fact. The credit a model assigns to a channel is an attribution view. The result that would have occurred without a marketing or product action is a causal question. Changing an attribution window may move credit without changing the underlying order. Adding attributed conversions reported by several platforms does not create a company-wide order ledger. Observing exposure and purchase together does not by itself establish incremental impact.
2. Confirm the change with counts, timing, and uncertainty
A rate can move because its numerator changed, its denominator changed, or both changed. A few late orders, a new source of ineligible visits, a filter change, or a partial day can create a dramatic-looking percentage.
Place the current and comparison windows side by side. Show absolute counts for eligible visits, real page arrivals, product actions, carts, checkout starts, payment attempts, authorizations, and confirmed orders. Label the unit on every row. Do not turn people, sessions, carts, payment attempts, and orders into one apparently continuous funnel.
Then ask:
- When is the first reproducible change point?
- Does the change persist across the observation windows chosen before examining the result?
- Are the absolute counts sufficient for an operational escalation, or is the apparent drop ordinary variation in a small sample?
- Have the data reached the agreed maturity point, including expected late events and backfills?
- Are the comparison windows aligned for timezone, weekdays, promotion state, eligibility, and market mix?
Change-point and time-series methods can make this work more disciplined, but they do not eliminate assumptions. Research on Bayesian structural time-series for causal impact illustrates how a counterfactual can be estimated under stated model conditions. Research on sample ratio mismatch in online experiments shows why allocation or sample-integrity problems can undermine interpretation. Neither paper turns a dashboard line into an automatic root-cause verdict.
An operating threshold should reflect the business's own baseline variation, data volume, and cost of delay. This article does not supply a universal percentage or number of hours. If the metric is not comparable or mature, the correct state is “measurement gap” or “continue observing,” not “site incident.”
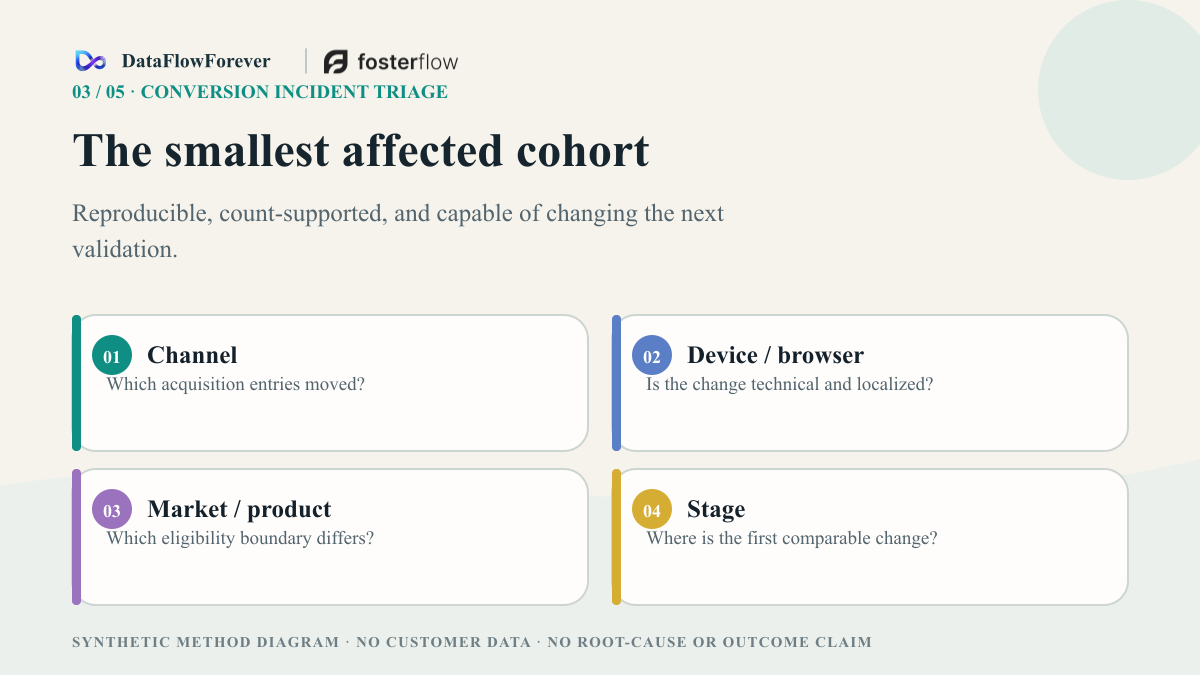
3. Locate the smallest affected cohort
Once the change is credible, segment by dimensions that can alter the next decision: channel, device, browser, landing page, product, market, language, new or returning customer, and relevant eligibility state.
The objective is not the smallest possible slice or the worst-performing row. A useful affected cohort is:
- reproducible under the same metric passport;
- supported by interpretable absolute counts;
- adjacent to an unaffected cohort that acts as a counter-signal; and
- specific enough to change the owner or scope of the next validation.
If every acquisition channel declines only in one browser, do not ask each media owner to rebuild campaigns. If one product group declines across channels and devices, product availability, price, offer, or template differences deserve attention. If one market first declines after payment initiation, inspect currency, payment method, browser, 3DS, risk, authorization, and delivery eligibility. If confirmed orders remain steady while one platform reports fewer conversions, keep the incident in measurement and attribution until evidence says otherwise.
Avoid post-hoc slicing. With enough combinations of hours, campaigns, devices, and products, a team can always find a dramatic cell. A cohort difference is localization evidence, not causal proof. Record what it supports, what contradicts it, what remains unknown, and whether the counts justify another split.
4. Build a change ledger across systems
“We did not change the website” often means one person does not remember publishing application code. An ecommerce journey can change through a theme, app, tag, consent setting, redirect, CDN, product feed, price, promotion, inventory state, shipping rule, payment configuration, risk rule, browser release, analytics definition, or third-party service.
For each material change, record:
- the exact time and timezone;
- the object, version, and before/after state;
- the person or system that initiated it;
- the intended and actual exposure scope;
- the expected observable effect;
- the evidence location; and
- whether and how it can be rolled back.
Shopify explains the coverage of its store activity logs, which can provide one source of administrative change evidence. Its guidance on testing theme performance emphasizes comparison under controlled conditions. These sources do not establish that every relevant change is logged, that performance caused a purchase change, or that a nearby release is the culprit.
Overlay the ledger with the observed change point. The result is a list of temporally plausible candidates. A release shortly before a mobile-arrival decline is a reason to reproduce or roll back under controlled scope. It is not yet a root cause. A promotion ending near a product conversion decline may coincide with demand, inventory, price, traffic mix, or several other changes.
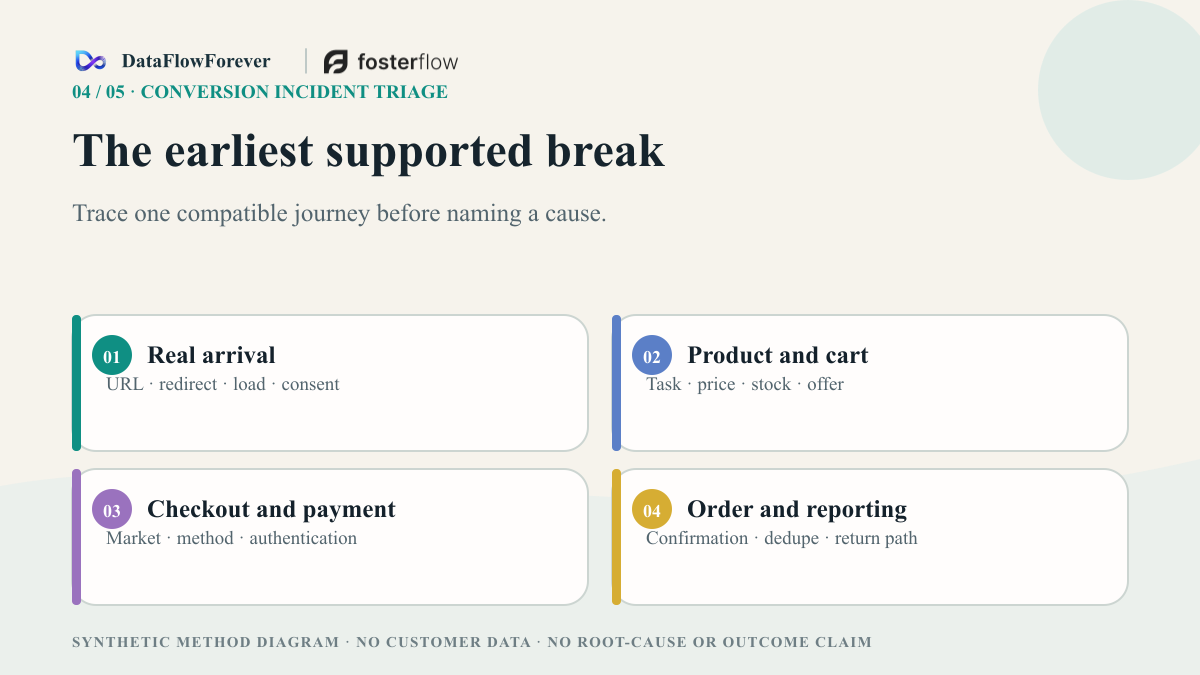
5. Trace the earliest observable funnel break
Use the same scope, window, unit, and fact basis to trace a journey such as:
Eligible demand → eligible delivery → real page arrival → product action → cart → checkout start → payment initiation → risk or authentication → authorization → order confirmation → later valid state.
The earliest break routes the investigation:
- Earliest reproducible change: Eligible impression or click · First checks: Demand, eligibility, budget, target, feed, query, geography · Premature conclusion to avoid: “The landing page failed”
- Earliest reproducible change: Click to real arrival · First checks: Destination, redirect, load, browser, consent, measurement · Premature conclusion to avoid: “The platform sent fake traffic”
- Earliest reproducible change: Arrival to product action · First checks: Intent, ad-to-page promise, product, price, stock, offer, page · Premature conclusion to avoid: “Design caused it”
- Earliest reproducible change: Cart to checkout · First checks: Fees, geography, delivery, account requirements, error states · Premature conclusion to avoid: “Customers suddenly became price sensitive”
- Earliest reproducible change: Payment start to authorization · First checks: Method, currency, browser, device, 3DS, risk, version · Premature conclusion to avoid: “The payment provider is down everywhere”
- Earliest reproducible change: Authorization to order confirmation · First checks: Capture, order creation, inventory contention, callbacks, idempotency · Premature conclusion to avoid: “Paid customers were invalid”
- Earliest reproducible change: Backend orders steady, platform conversion down · First checks: Event, return path, deduplication, window, report maturity · Premature conclusion to avoid: “Business conversion collapsed”
Payment needs its own denominators. A person can open more than one checkout. An order can contain several payment attempts. An attempt can produce multiple authentication and authorization states. Shopify's payment troubleshooting guidance and public status page provide diagnostic entry points; neither proves the cause for a specific merchant. Investigation also does not authorize a team to change routing, risk rules, or sensitive payment systems without the appropriate approval and data boundaries.
6. Label evidence before writing the action
Incident notes often compress an observation, explanation, and fix into one sentence: “Mobile conversion fell because the release broke checkout, so revert it.” Separate that sentence into five evidence states:
- Fact: Directly observed within a named scope, unit, window, and source.
- Inference: An interpretation supported by facts but dependent on assumptions.
- Hypothesis: A candidate explanation that the next evidence can support or weaken.
- Recommendation: An action intended to create evidence or control bounded risk.
- Gap: Evidence that is unavailable, immature, inaccessible, or not comparable.
Add a counter-signal to every important hypothesis. “Authorization declined for one mobile browser” may be a fact. “The new checkout script conflicts with that browser” is a hypothesis. “Another market uses the same script without the decline” is a counter-signal. “The safely shareable error category is unavailable for the incident window” is a gap. “Reproduce the exact market, browser, method, and version in a controlled environment” is a recommendation.
Public Reddit and X conversations frequently describe sudden declines through the language of low-quality traffic, platform changes, themes, speed, checkout, payment, or tracking. Those discussions are qualitative voice-of-customer material only. They can expand the question set; they cannot establish prevalence, benchmarks, current platform behavior, or the cause of a particular incident. No author identity, handle, or verbatim thread content is needed to use the signal safely.
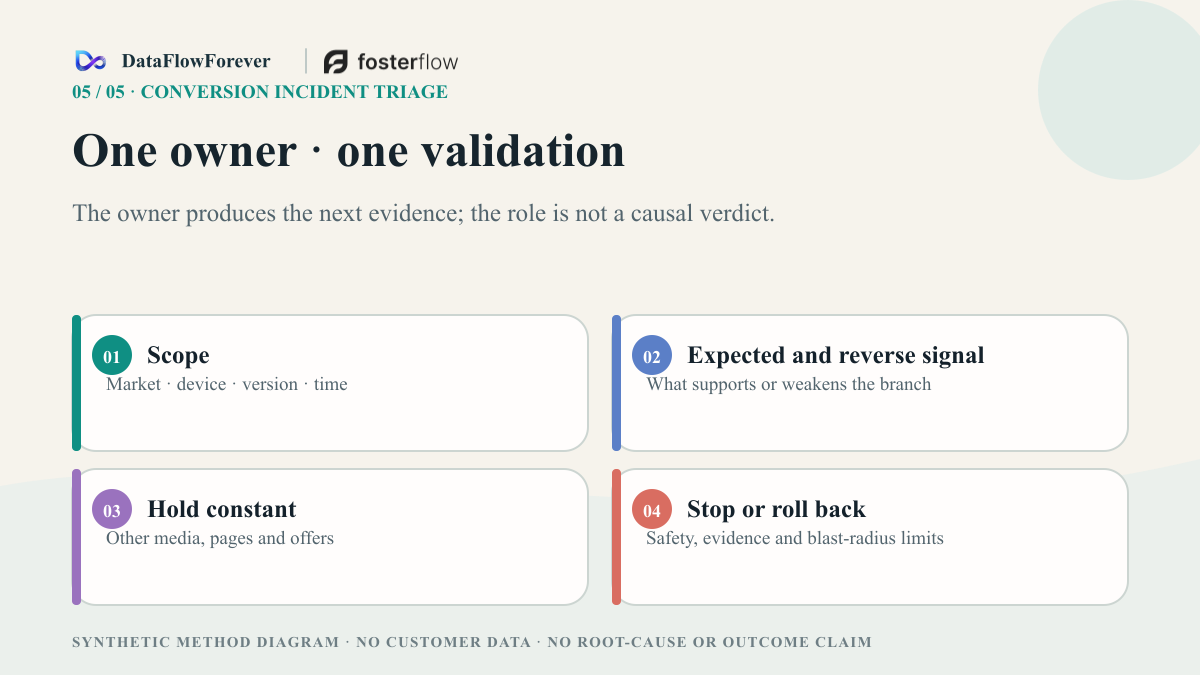
7. Assign one owner to one bounded validation
The primary owner owns the next evidence-producing action, not the moral responsibility for the incident. Other functions can assist, but parallel uncontrolled changes should remain paused.
A useful action card specifies:
- Field: Primary owner · Required content: One named role responsible for the validation and evidence return
- Field: Scope · Required content: Market, device, browser, page, product, version, and time boundary
- Field: Hypothesis · Required content: The candidate explanation being tested
- Field: Action · Required content: One reproduction, rollback, comparison, exclusion test, or measure-only task
- Field: Expected signal · Required content: What should be observed if the hypothesis gains support
- Field: Counter-signal · Required content: What would weaken or redirect the hypothesis
- Field: Hold constant · Required content: Which campaigns, pages, offers, code, or adjacent systems must not change
- Field: Stop or rollback · Required content: The safety, evidence, or blast-radius condition that ends the action
- Field: Evidence return · Required content: When and how results, limits, and unresolved gaps will be reported
Consider a fully synthetic incident. It represents no merchant, customer, account, deployment, or observed performance.
The metric passport uses confirmed deduplicated orders over consented, eligible real arrivals. The change remains after the maturity window. It is localized to one market and mobile browser. Page arrivals, carts, and checkout starts remain comparable; the first break appears between payment initiation and authorization. The change ledger contains both a theme release and a payment-configuration version near the change point.
The payment-stage decline is a fact. A configuration-and-browser incompatibility is a hypothesis. Stable upper-funnel behavior is counter-evidence against a broad product-page explanation. Missing safely shareable error categories are a gap.
One payment owner receives one task: reproduce the specified market, browser, method, and version in an approved test environment while advertising, page design, offers, and other payment paths remain unchanged. A matching failure stage and error class would support the branch. Failure to reproduce, or a different failure stage, would weaken it. Evidence requiring unauthorized sensitive-data access, or any effect outside the approved path, stops the test.
This example deliberately ends before a root-cause claim. Good triage can conclude that evidence is insufficient and the correct next state is measure-only or hold. That is more useful than shipping several plausible fixes and losing the comparison.
What an initial incident review should produce
With the required data access prepared, an initial review does not need a long optimization backlog. It needs seven outputs:
- a frozen metric passport;
- absolute counts, the change point, and current uncertainty;
- the smallest reproducibly affected cohort;
- a cross-system change ledger aligned to that point;
- the earliest comparable funnel break;
- facts, inferences, hypotheses, recommendations, gaps, and counter-signals kept separate; and
- one primary owner with one bounded validation and a stop condition.
The process does not promise a fast root cause or a conversion recovery. It gives the organization something more durable: after the next action, the team can still say what changed, what the evidence supports, what it does not support, and who should obtain the next piece of evidence.
When conversion drops suddenly, speed matters. Preserving interpretability is part of speed.