
Why Your Weekly Report Doesn't Produce Decisions
Every chart is correct and the meeting still ends without a decision. The gap is not data quality; it is that the report was never tied to a decision. Four checks, one template, and a pre-publish checklist.
Short answer: when a report is read and nothing happens, the usual cause is not bad data. It is that the report was never tied to a decision — it does not say which decision it supports, who owns that decision, or when the result gets re-checked. Add those three lines, then run four checks: definitions, maturity, states, and the three chart questions.
Agencies and in-house teams rarely need another dashboard. They need the last mile between a correct number and a decision someone is accountable for. What follows is a working checklist rather than a theory: four checks, a template you can copy, and the boundaries that keep each claim honest.
1. The report is not the problem. The missing decision contract is.
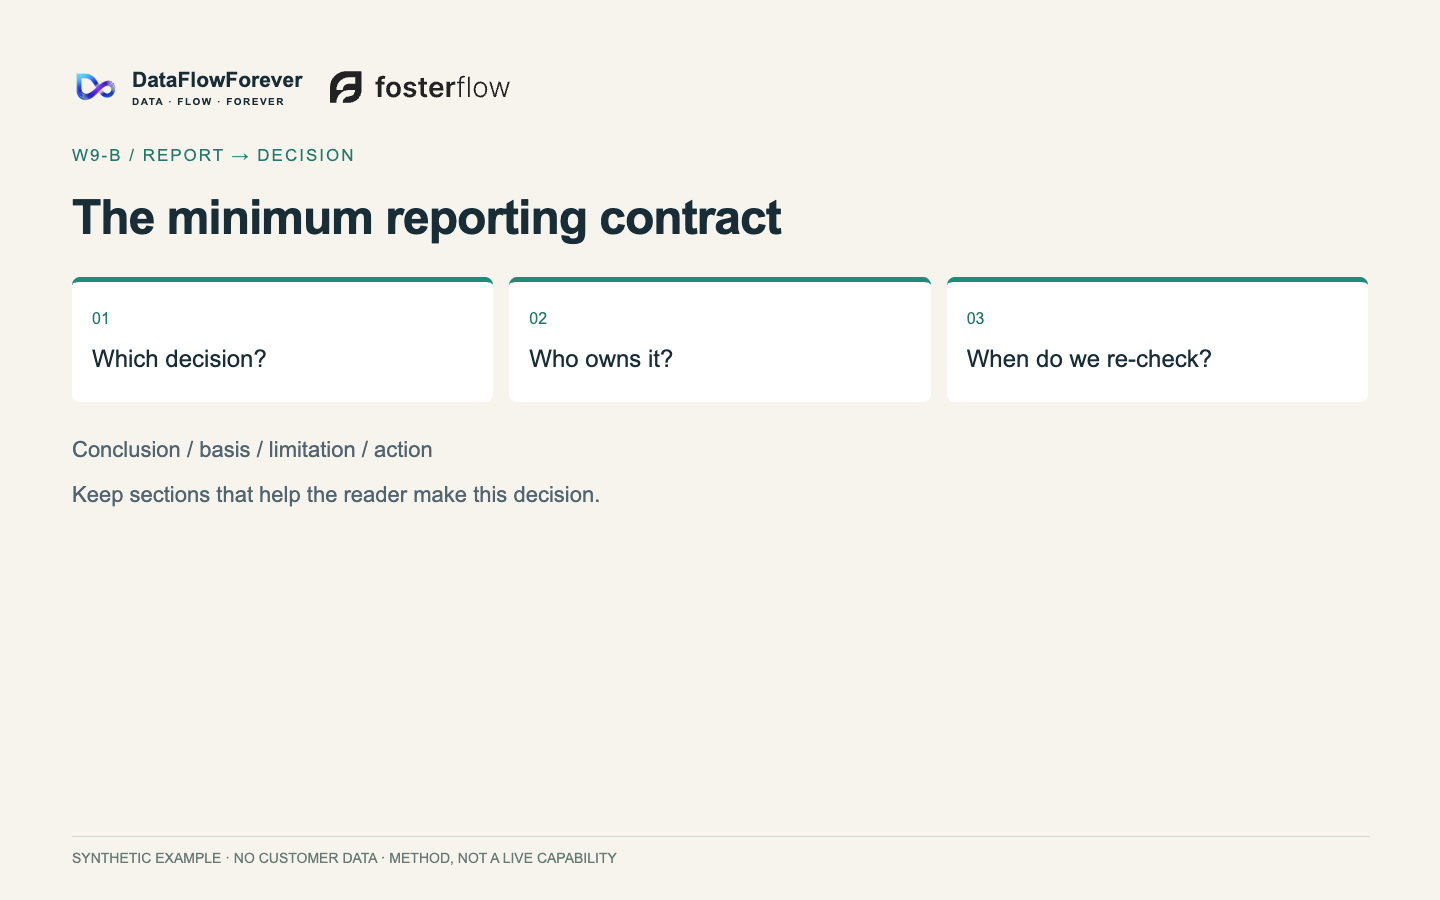
Direct answer: a recurring report only earns its place once it states the decision it supports, the person accountable for that decision, and the next re-check. Without those three lines, seventeen pages and one page behave the same way — the reader finishes and has nothing to do.
Three independent bodies of evidence point the same direction. First, practitioner communities: the same complaint recurs across analytics, BI, operations and management forums — reporting continues, meetings continue, and nobody can name what changed as a result; the same request returns a fortnight later; retrospectives rediscover root causes that were written up months earlier. Second, institutional guidance: the UK Government Analysis Function states plainly that dashboards shift the burden of understanding data onto users, are not good at explaining what is happening in the data, and can overwhelm users or invite misuse of statistics. Third, reading behaviour: NN/g's usability research found 79% of test users always scanned a page and only 16% read word by word, while rewriting the same content to be concise, scannable and objective improved measured usability by 58%, 47% and 27% respectively — 124% for all three together. That study was published in 1997 about web pages, so treat it as a mechanism, not a forecast for your team.
Boundary: none of this proves that a long report causes the absence of decisions. What it does establish is that length, chart count and automation are not sufficient conditions for a decision.
Do this first: put three lines at the top of the report — the decision, the owner, the re-check. If you cannot write them, the report is not ready to exist yet.
Design for scanning while you are there: conclusion first, one idea per paragraph, headings that carry a real noun ("Refund definition changed", not "Insights"), key numbers bolded, and long sections split into one judgement plus one line of basis.
2. Check one: definitions travel with the number
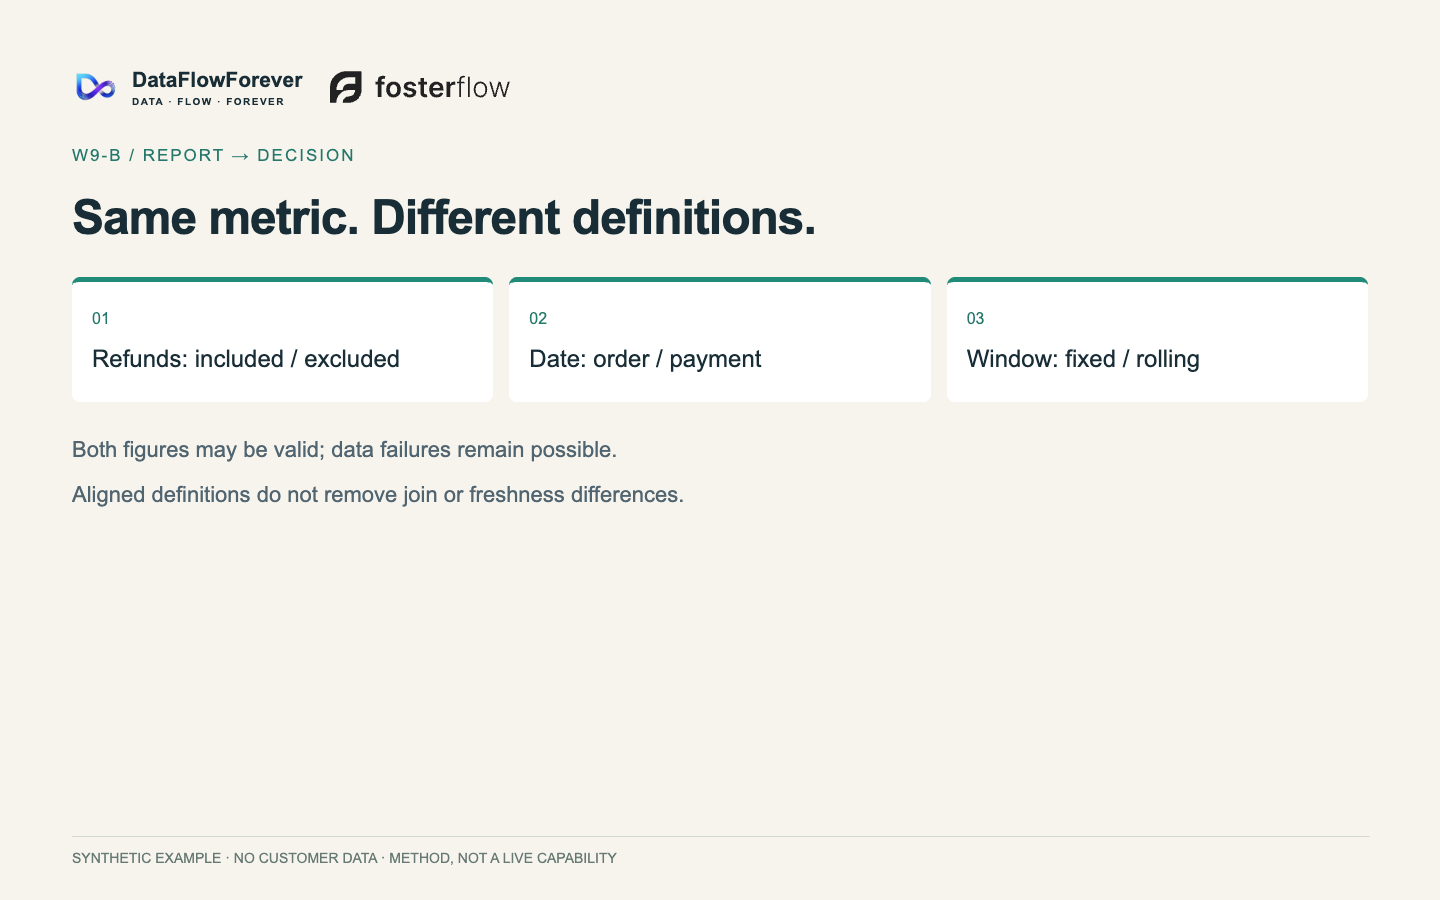
Direct answer: when two reports disagree about the same metric, freeze the definition, the window, the denominator and the source state before you question data quality. Most disagreements are definitional.
The four disagreements we see most often:
- Disagreement: Refunds; Common version A: Gross; Common version B: Net of refunds; What must be stated: Refund treatment and refund timing
- Disagreement: Date basis; Common version A: Order date; Common version B: Payment date; What must be stated: Attribution date and restatement rule
- Disagreement: Credit rule; Common version A: Last touch; Common version B: First touch; What must be stated: Credit policy and comparison period
- Disagreement: Platform dating; Common version A: Click date; Common version B: Platform confirmation date; What must be stated: Whether recent days are still being revised
Platform documentation is unusually concrete here. Shopify splits report ranges into fixed and rolling: a rolling range includes the current, unfinished period by default, marks it as in progress in the visualisation, and declares the comparison explicitly through syntax such as COMPARE TO rather than inheriting a default. In other words, "up or down" depends on the comparison the author chose — that is a switch you can put in a report specification. GA4 documents that when an audience is too small to protect identity, rows are withheld and a threshold notice appears: the report looks complete while values are missing.
Boundary: do not turn this into "all discrepancies are definitional". Collection, identity continuity and dropped events cause real differences too, and even with one agreed definition, different joins and different source freshness can return different answers to the same question. The value of this check is the order it imposes: freeze the definition, then investigate the data.
Do this: beside every headline number, print definition, window, denominator, source state, and the decision it serves.
3. Check two: the newest period is provisional
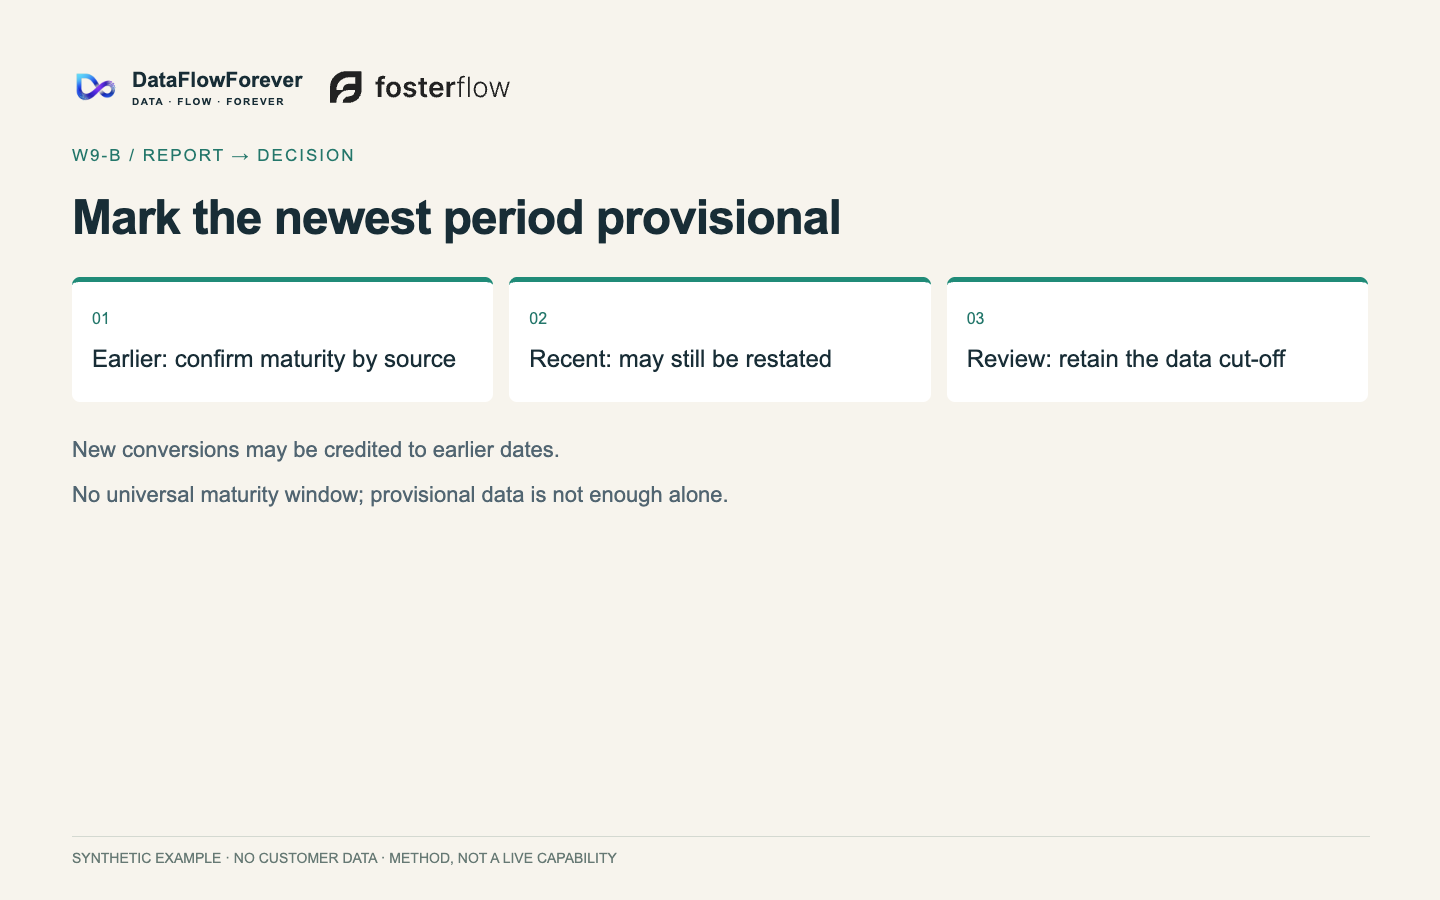
Direct answer: the last few days in a platform report are usually still accruing and being restated, so the most recent period can only be a signal — never the sole basis for an action.
What the platforms themselves document:
- Conversion restatement. Newly received conversions are attributed back to earlier dates, so the most recent days are incomplete when first reported and are adjusted later.
- Layered freshness. GA4 separates realtime, intraday and standard reporting; standard reports continue processing after events arrive.
- Thresholds and privacy. When the audience in scope is too small, GA4 withholds rows and shows a threshold notice — the report looks whole while values are hidden.
- Refresh limits. Power BI allows eight scheduled refreshes a day on shared capacity and 48 on Premium; dashboard tiles refresh roughly hourly; and if nobody visits a semantic model for two months, the service pauses its refresh schedule and emails the owner.
That last item deserves its own sentence: a dashboard can die quietly from disuse. It is not retired because decisions moved on; it is retired because nobody looked, while the organisation still believes it is alive.
Boundary: this is not "platform data is untrustworthy". It is "the newest period is not mature yet". This article deliberately does not give a fixed number of days after which numbers become safe — that window has to be declared per source and per business cycle.
Do this: stamp the data cut-off on every decision-facing report, and mark the newest period provisional, excluded from any conclusion larger than a single action.
Why cross-border teams hit this hardest: orders live in Shopify, traffic in GA4, spend in several ad platforms, fulfilment in a warehouse system, and every one of them has its own date basis and attribution rule. Add time zones and the same "last week" is not the same interval anywhere. That is not negligence; it is the default state of multi-source data — which is why it has to be declared rather than assumed.
4. Check three: six states must never collapse
Direct answer: not executed, no access, a true zero, insufficient evidence, a third-party estimate, and a verified result are six different facts. Writing any of them as a zero puts every downstream judgement on a false floor.
- State: Not executed; Typical mis-write: Written as zero; Consequence: An untested action gets cut
- State: No access; Typical mis-write: Written as zero; Consequence: A channel looks worthless when it was unreadable
- State: True zero; Typical mis-write: Written as "no data"; Consequence: A real signal gets ignored
- State: Insufficient evidence; Typical mis-write: Written as a conclusion; Consequence: Guesswork replaces judgement
- State: Third-party estimate; Typical mis-write: Written as measured; Consequence: An estimate hardens into fact
- State: Verified result; Typical mis-write: Blended with the rest; Consequence: Facts and assumptions become indistinguishable
Boundary: the labels can be localised, but the six meanings must be complete and mutually exclusive — and they belong beside each number, not in a disclaimer at the end of the deck.
5. Check four: charts answer three questions
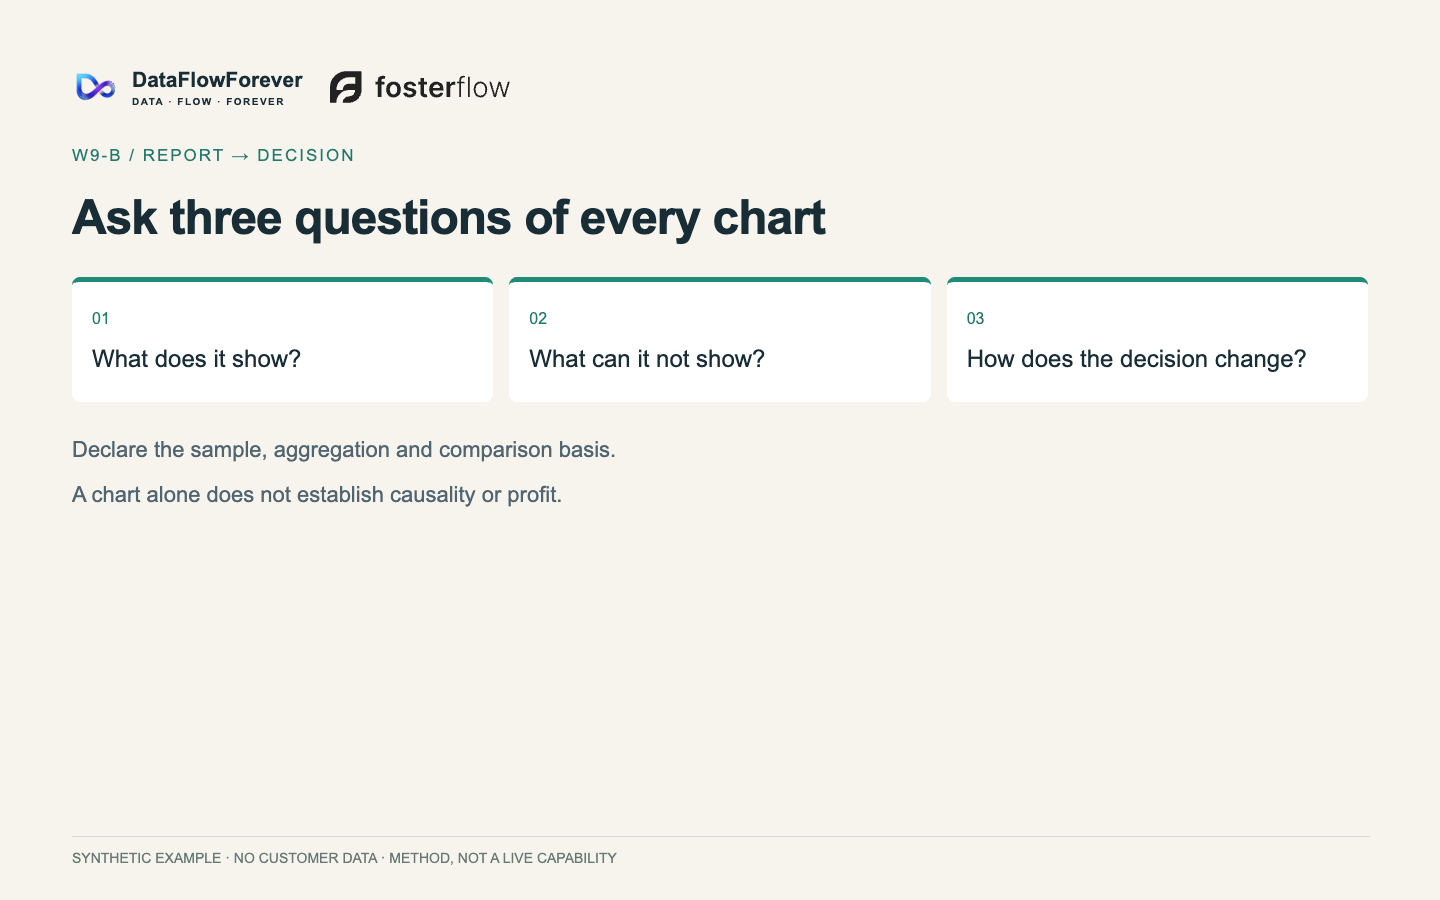
Direct answer: every chart on a decision page must answer what it shows, what it cannot show, and how it changes the decision. A chart that cannot answer the third question is decoration.
Two supporting sources, one internal and one institutional. The method contract: conclusion, basis, limitation, action — and for each key chart, what it shows, what it cannot show, what it means for the decision. The institutional habit: guidance on dashboards requires a change note and an explicit statement of the period the data refers to whenever data is updated. Two practitioner counterexamples are worth keeping in your pocket: a single label covering two different quantities (throughput as one user experiences it versus throughput the whole system emits — batch more users and the system number rises while every user gets slower), and averages hiding a skewed distribution (a handful of slow requests drag the mean while the median barely moves).
One division of labour is worth stating explicitly: dashboards are good at showing state on demand, reports are good at explaining what happened and what happens next. Push explanation into a dashboard and readers will each interpret it differently — which is exactly the misuse of statistics that institutional guidance warns about.
Boundary: do not turn this into "always use percentiles". Percentiles are noise at low volume, and chart type follows the decision, not fashion.
Do this: ask only the third question of every chart. If it cannot name the decision it changes, move it to the appendix.
6. Experiment readouts: write the rule before you run the test
Direct answer: fix the primary metric, the threshold, the sample and period, the counter-evidence condition, the owner and the re-check date before the test starts. Without them a readout only extends the argument.
Practitioner threads show the failure mode clearly: a team cannot agree on a design decision, so "let's A/B it" closes the meeting — but nobody defined which metric decides, or whether the test can reach a decidable difference in a reasonable period; the test finishes and the argument continues. Research supplies the other half: formal work on Goodhart's law shows that whether optimising a proxy measure helps or harms the real objective depends on the tail behaviour of the gap between them — with heavy tails, over-optimising can be actively harmful. In plain language: before you make a number a target, ask under what conditions it stops tracking what you meant.
Boundary: a pre-declared rule does not guarantee a correct conclusion, only a decidable one. And attribution is not a counterfactual: it says who received credit, not what would have happened without the spend — and revenue lift can diverge from profit lift.
7. A weekly report template you can copy
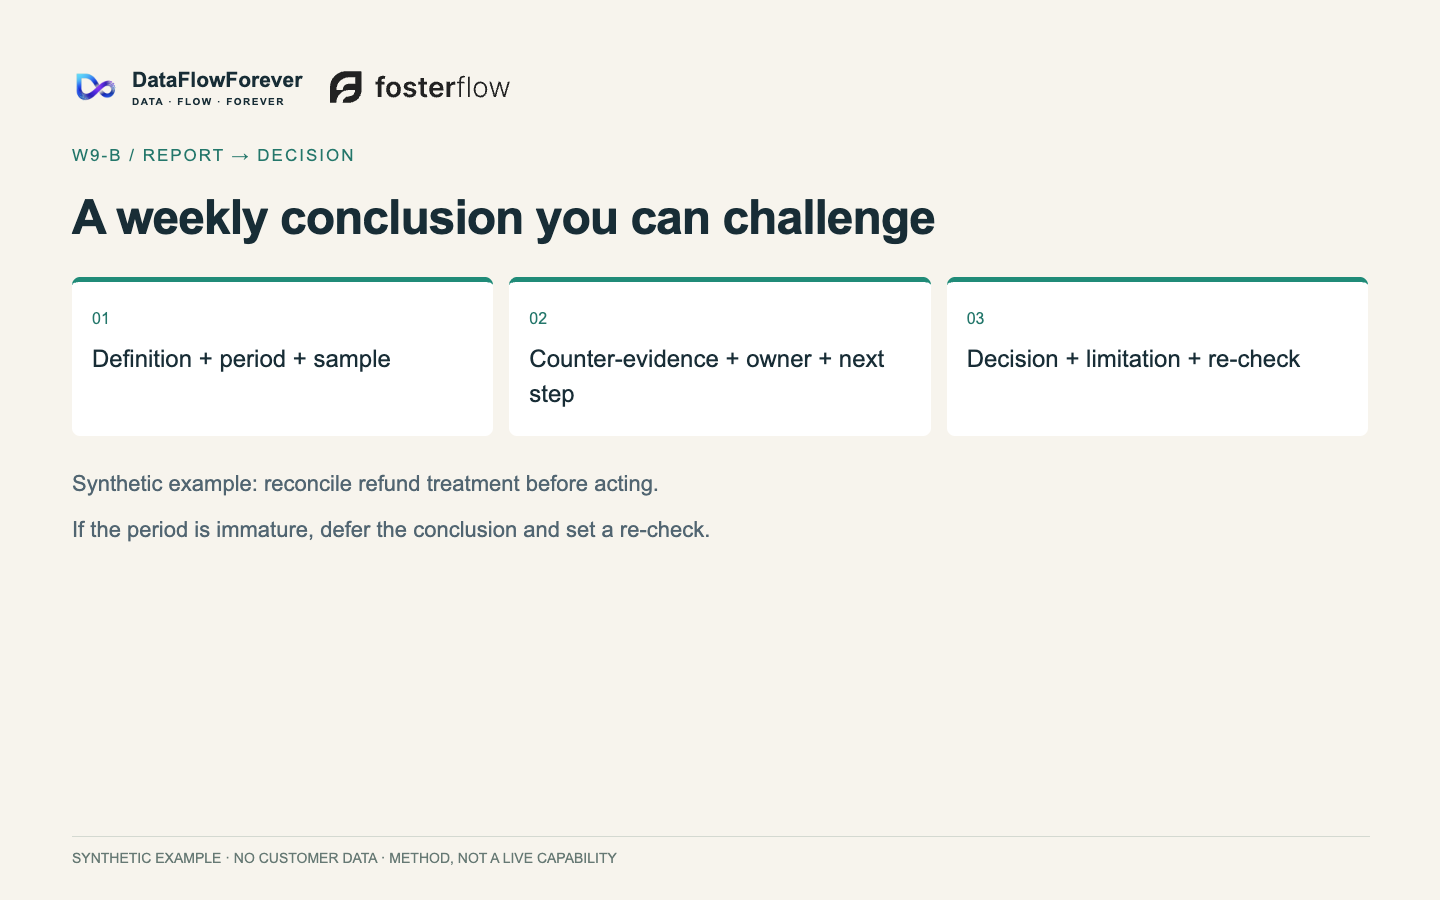
Here is a synthetic traceable fragment — no real store data — showing the six fields we expect around a material conclusion:
- Definition: first-order contribution from new customers, after product cost, fulfilment and the acquisition cost of that order; excluding tax.
- Period: the complete calendar week, data cut off two days later at 09:00.
- Sample: 412 first orders; 37 are still inside the return window and are counted at worst case.
- Counter-evidence: on platform-attributed numbers this week would show about 10% more new-customer first orders, because last week's conversions were restated into it; on the warehouse definition there is no such increment.
- Owner: head of growth.
- Next step: one action only — change the second touch of the September recovery path from 48 hours to 20, everything else unchanged; re-check the same definition next week for first-order contribution and unsubscribe rate, and roll back if either deteriorates.
Why this beats "more detail": once a conclusion carries its definition, period, sample, counter-evidence, owner and next step, it no longer needs length to look rigorous — and a reader can disagree with one specific line instead of a vague feeling.
How to run the meeting with it: treat the fragment as page one. Read the definition and period (about thirty seconds), read the counter-evidence (it states when the conclusion does not hold), then discuss only the next step and the owner. Everything else stays in the appendix.
8. Retire before you automate
Direct answer: before automating a weekly report, run the delete test. A report nobody can attach to a decision is a retirement candidate, and automation only converts a decision-free task into a permanent cost.
Public-sector guidance on retiring dashboards offers a reusable logic: when a dashboard is no longer useful, relevant or value for money, retire it — and tell readers in advance, with a note on where the data remains available. On why reports grow in the first place, one line of research models information overload in managerial reporting as supplier-induced demand: the person supplying the report gains visible value from volume while raising the reader's switching cost, so reports drift longer, and the more specific the information, the stronger the effect. That is a theoretical model, not a field measurement. Its management implication is narrow: do not try to fix report length by asking people to write less. Length is an incentive problem.
Retirement checklist:
- Which decision does this section change, and who makes that decision?
- Did it actually change anything last period? Two periods without an example means one recorded "unused".
- Is its source still alive — is the refresh paused, has the definition been superseded by another table?
- If you stopped it, who would notice first? If nobody, it is no longer on the decision path.
- Who has to be told before it retires, and where does the data remain available?
Boundary: internal reports are not bound by public-statistics archiving duties, and "stop it for two weeks" should not become a universal process. Retirement is a formal action, not silent abandonment.
9. FAQ
How long should a weekly report be? Length is not the standard. The standard is whether it states a decision, an owner and a re-check. Once it does, sections that do not serve that decision tend to delete themselves.
Two reports disagree. Which number do I trust? Check the definition before the platform: refund treatment, order versus payment date, credit rule, and whether recent days are still being restated. Only after those align does data quality become the question.
Why does our reporting always look worse for the newest week, then improve? That is conversion restatement, not a sudden business decline. Mark the newest period provisional and exclude it from conclusions larger than one action.
Can AI write the weekly report? It can draft it — provided every number traces back to an approved definition and the output is allowed to say "insufficient evidence". Traceability and refusal are preconditions, not later improvements.
Are dashboards and reports redundant? They do different jobs: dashboards show state on demand, reports explain what happened and what happens next. Explanation pushed into a dashboard gets interpreted differently by every reader.
10. Pre-publish self-check
Run this before the next weekly report goes out; it takes about ten minutes.
- The report opens with the decision, the owner and the re-check.
- Every headline number carries definition, window, denominator, source state and decision use.
- The newest period is marked provisional with a data cut-off.
- The six states are not blended.
- Every chart on the decision page answers the three questions; the rest are in the appendix.
- At least one conclusion is written in the six fields.
- No number in the report is untraceable to its definition.
- If a model generated any part of it: every number traces to an approved definition, and "insufficient evidence" is an allowed output.
11. Where to go next
If this checklist is useful, the cheapest next step is not a new tool. It is three changes this week: add the three opening lines, annotate each headline number, and rewrite one conclusion in the six fields.
If your reporting has already moved past "does anyone read it" and is stuck on reconciling several platforms, several definitions and several periods, that is an operating-data problem rather than a formatting problem. In our annual growth partnership we build the definitions, the report structure and the review cadence as an asset the company keeps — not as a set of one-off reports. If that is the stage you are at, the partnership entry point is the right conversation to have.
Boundaries
Every mechanism in this article comes from platform documentation, bounded independent research, or our own documented method. Community material is used only for scenes and counterexamples — never as a benchmark or causal evidence. No fixed thresholds are prescribed, no results are promised, and no client, store or account appears anywhere; the report fragment is synthetic. Pre-publish checks (canonical, sitemap, structured data, desktop and mobile rendering) are run once before publication and are not re-scanned afterwards.